

ROI Calculator
Use the ROI Calculator to see how your SmartAsset subscription can turn into clients, assets under management (AUM) and revenue over time. Enter your subscription and business details, then move the slider to model how many clients you convert each year.
Use it to answer questions such as:
- If I convert 3 clients, does this pay for itself?
- How long until I break even?
- What happens if my conversion rate changes?
- Which subscription option looks better for my firm?
Open the ROI Calculator
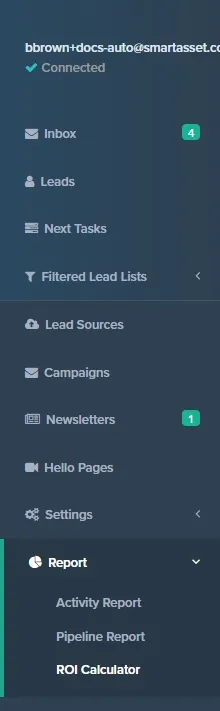
Section titled “Open the ROI Calculator”- Go to Report > ROI Calculator. The ROI Calculator page opens.
Enter your inputs
Section titled “Enter your inputs”The calculator fills in starting values for you. Change any of them to match your practice. The results update as you type.
AMP subscription
Section titled “AMP subscription”-
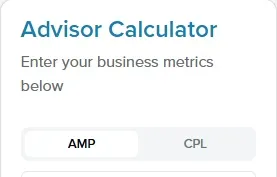
In the Advisor Calculator panel, click the AMP tab.
-
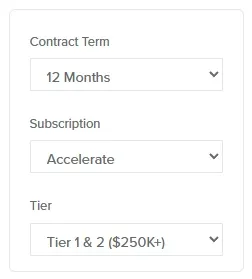
Choose a Contract Term.
-
Choose a Subscription.
-
Choose a Tier. The results update for that subscription.
CPL (cost per lead)
Section titled “CPL (cost per lead)”- In the Advisor Calculator panel, click the CPL tab.
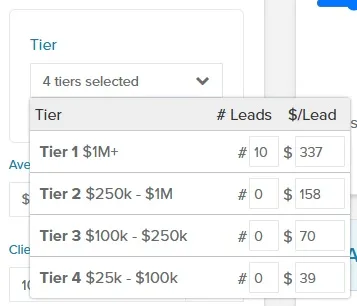
- Click the Tier list. The list of lead tiers opens.
- For each tier, enter the number of leads you get per month under # Leads.
- For each tier, enter your cost per lead under $/Lead. The results update for those leads.
Business metrics
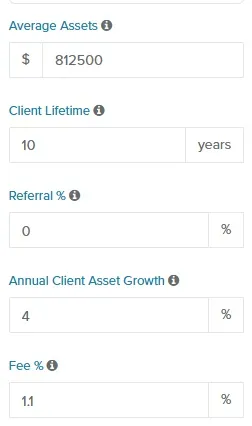
Section titled “Business metrics”These fields, below the tabs, drive the revenue side of the estimate:
| Field | What it does |
|---|---|
| Average Assets | Average assets per client. Filled in from the tiers you choose; change it to match your clients. |
| Client Lifetime | How many years the average client stays with you. Default is 10 years. |
| Referral % | The percentage of your total clients you expect to gain as new referrals each year. Default is 0%. |
| Annual Client Asset Growth | How much client assets grow each year. Default is 4%. |
| Fee % | The annual fee you charge on assets. Default is 1.1%. |
Adjust Clients Converted Per Year
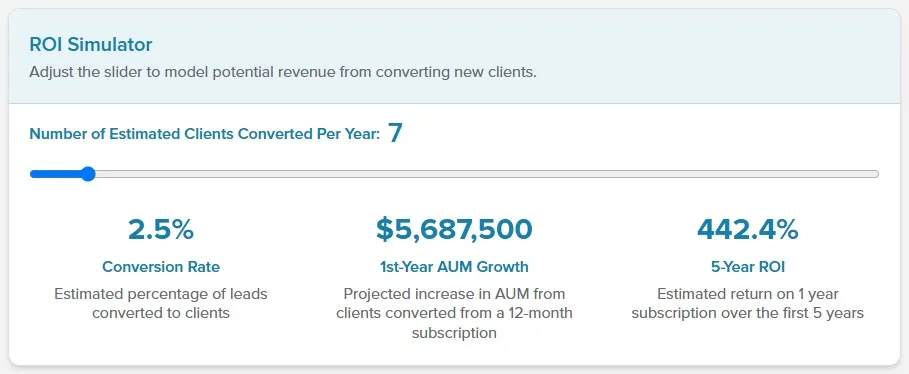
Section titled “Adjust Clients Converted Per Year”- In the ROI Simulator section, drag the Number of Estimated Clients Converted Per Year slider. The results update when you release it.

Understand the results
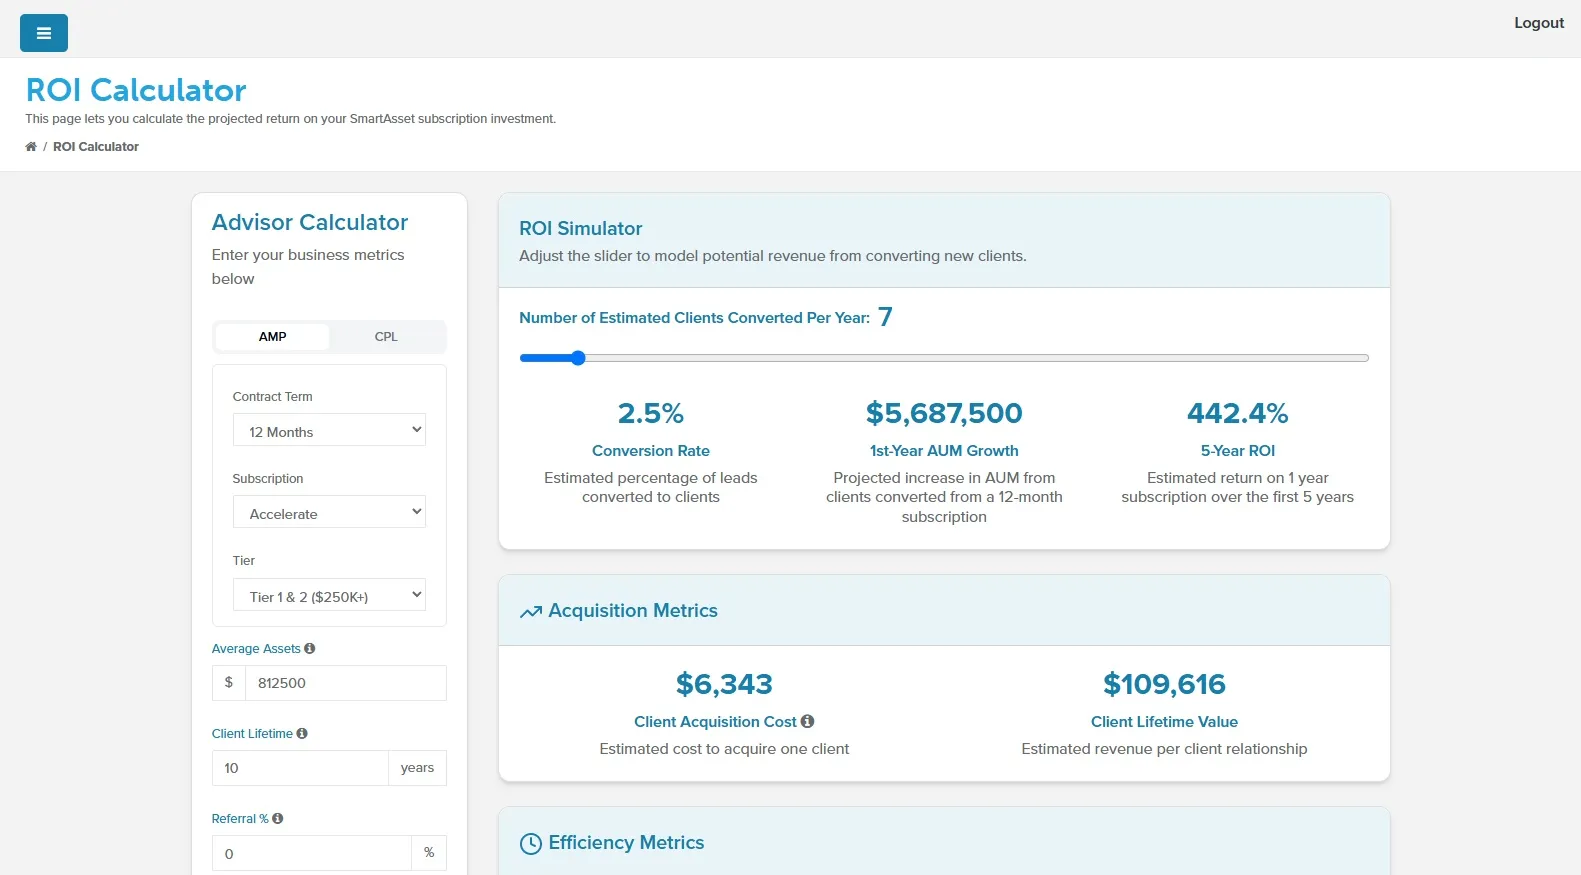
Section titled “Understand the results”ROI Simulator
Section titled “ROI Simulator”The ROI Simulator shows your conversion rate, first-year AUM growth and five-year return on investment for the number of clients you convert.
Conversion Rate
Section titled “Conversion Rate”The percentage of your leads that become clients in this scenario. Leads per year come from your AMP tier, or from the # Leads you entered for CPL. If the rate doesn’t match your actual results, move the slider until it does.
Formula: Clients Converted Per Year ÷ Leads Received in 12 Months × 100%
1st-Year AUM Growth
Section titled “1st-Year AUM Growth”The projected increase in AUM from the clients you convert during a 12-month subscription. Use it to compare scenarios when you care most about near-term growth.
Formula: Average Assets × Clients Converted Per Year
5-Year ROI
Section titled “5-Year ROI”Your net return over 5 years on a 1-year subscription: the fees your converted clients pay over 5 years, minus 12 months of subscription cost, divided by that cost.
- 100% means you earn about $2 in fees for every $1 you spend on your subscription.
- 400% means you earn about $5 in fees for every $1 you spend.
For example, on a $12,000 subscription:
- 400% ROI: $12,000 × 5 = $60,000 in fees over 5 years
- 250% ROI: $12,000 × 3.5 = $42,000
- 100% ROI: $12,000 × 2 = $24,000
Acquisition Metrics
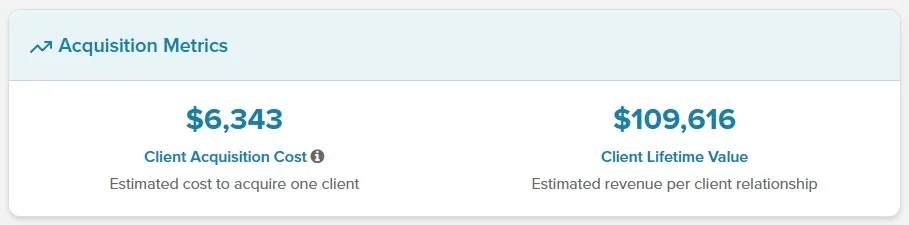
Section titled “Acquisition Metrics”Acquisition Metrics shows what it costs to get a client and what a client is worth over time.
Client Acquisition Cost
Section titled “Client Acquisition Cost”The average cost to get one client through SmartAsset. For example, spending $12,000 a year and converting 3 clients gives an acquisition cost of $4,000 per client.
Formula: Annual subscription cost ÷ Clients Converted Per Year
Client Lifetime Value
Section titled “Client Lifetime Value”The total fees a client pays over their whole relationship with your firm.
Formula: Average Assets × Fee % × Client Lifetime, with assets growing each year by the Annual Client Asset Growth
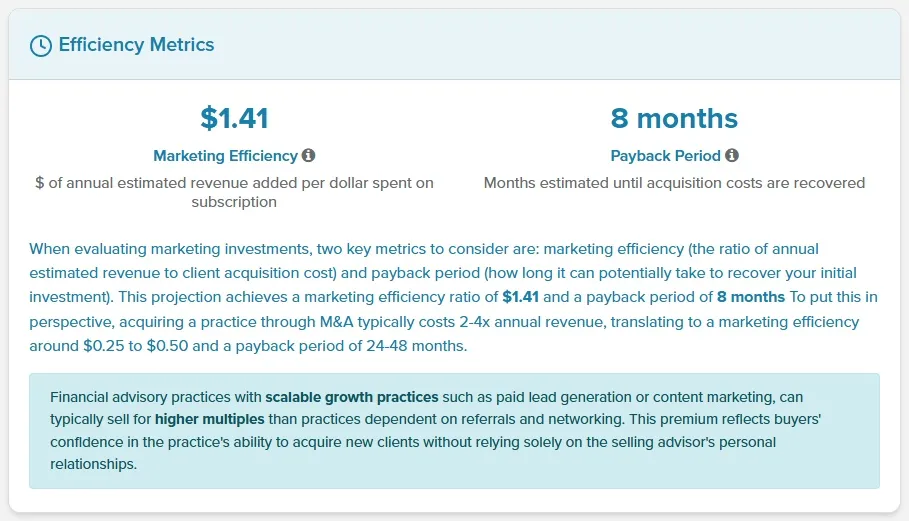
Efficiency Metrics
Section titled “Efficiency Metrics”Two metrics help you judge a marketing investment.
Marketing Efficiency
Section titled “Marketing Efficiency”How much you earn in fees each year for every $1 you spend on marketing. For example, a marketing efficiency of $1.50 means $20,000 spent on marketing brings in $30,000 in fees per year.
Formula: (Average Assets × Fee %) ÷ Client Acquisition Cost
Payback Period
Section titled “Payback Period”How many months it takes a new client’s fees to cover what it cost to get that client.
Formula: Client Acquisition Cost ÷ (Average Assets × Fee % ÷ 12)
Cash Flow
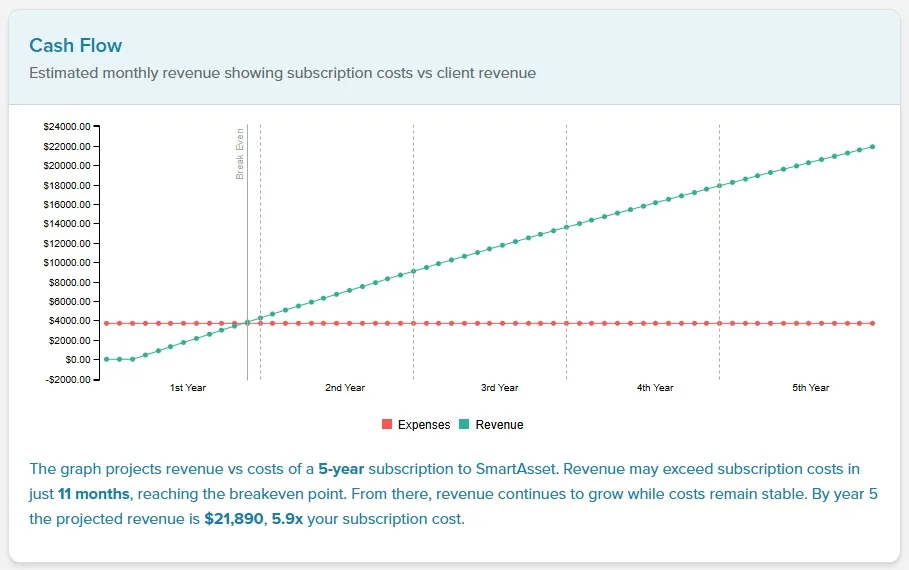
Section titled “Cash Flow”The Cash Flow chart compares your monthly subscription cost (Expenses) with the monthly fees from your converted clients (Revenue) over a 5-year subscription. The Break Even line marks the first month when revenue covers the subscription cost. The summary under the chart gives the time to break even and your monthly revenue in year 5 as a multiple of your monthly cost.
Payback Period vs. Break-Even Point
Section titled “Payback Period vs. Break-Even Point”These two metrics answer different questions: payback looks at one client, while break-even looks at your whole subscription.
| Metric | What it measures |
|---|---|
| Payback Period | Client level. How many months it takes one new client’s fees to cover what it cost to get that client. |
| Break-Even Point | Subscription level. The first month when the monthly fees from all your converted clients cover the monthly subscription cost. |
Related Guides
Section titled “Related Guides”- Reporting Overview: the three reports and who can see them
- Pipeline Report: follow your SmartAsset leads from delivery to target conversion