

Activity Report
The Activity Report shows how your outreach compares with top advisors in five areas: Outbound Calls, Consistency, Salesmanship, Response Times and Idle Leads. Each chart includes tips for improving your results.
To open this page, go to Report > Activity Report.
The report covers SmartAsset leads only, and counts activity from everyone in your company, not just you.
Each chart has its own date range. To download a chart’s data as a CSV file, click the download icon on the chart. To download every chart’s data, click Export historical data at the top of the page. Exports include all dates, not just the range you selected.
Sections of the Activity Report
Section titled “Sections of the Activity Report”Outbound Calls
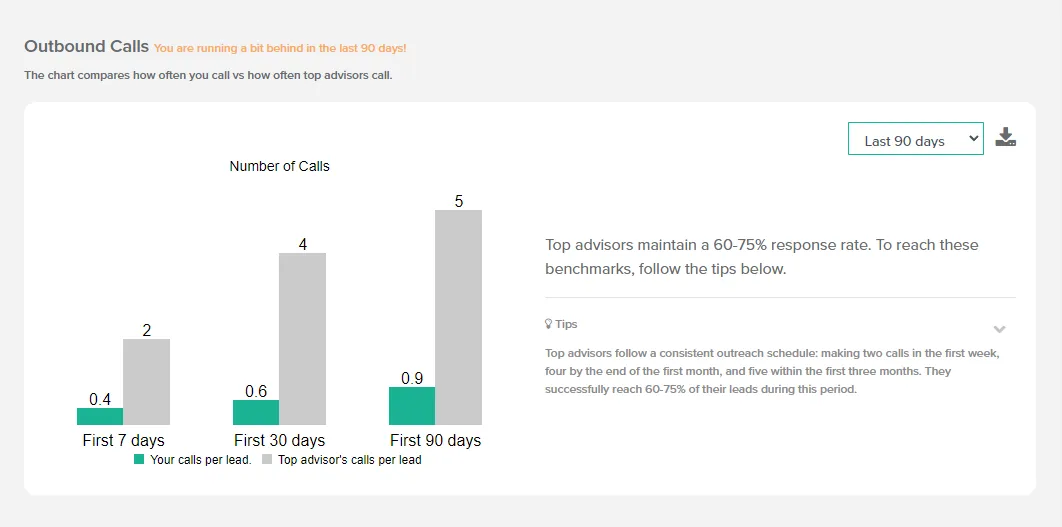
Section titled “Outbound Calls”Outbound Calls compares your average calls per lead with top advisors, in each lead’s first 7, 30 and 90 days. It counts leads received in the selected range (Last 30 days by default). Top advisors make:
- 2 calls per lead in the first 7 days
- 4 calls per lead in the first 30 days
- 5 calls per lead in the first 90 days
Top advisors who follow this schedule reach 40–60% of their leads. If you’re below these benchmarks, call new leads sooner and more often in their first weeks.
Consistency
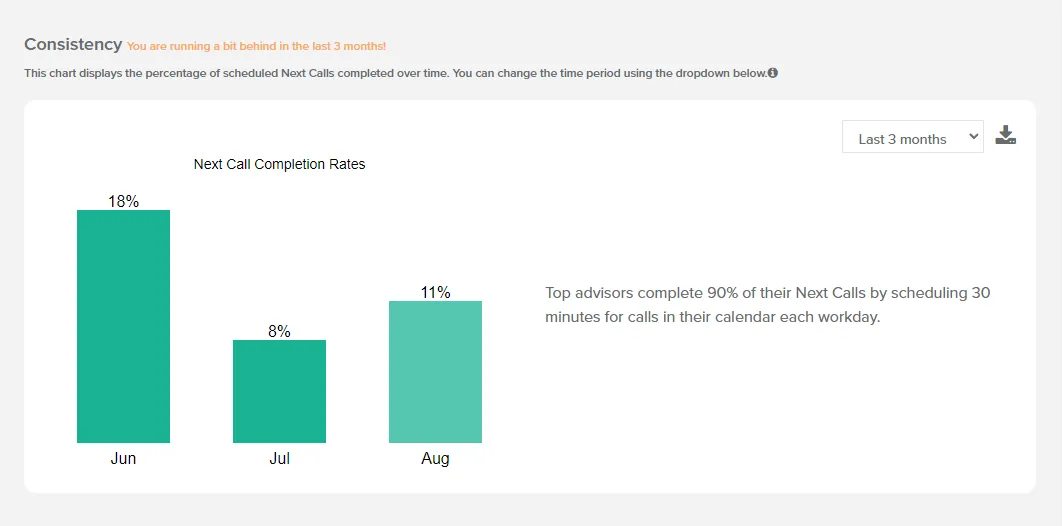
Section titled “Consistency”Consistency shows the percentage of your scheduled call tasks completed each week (Last 28 days, the default) or each month (Last 3 months, Last 12 months). Skipped and overdue call tasks count as missed. Top advisors complete at least 90% in every period.
To stay on top of your outreach, block time in your calendar each workday to work through your call tasks on the Next Tasks page. If your percentages are low, block off more time.
Salesmanship
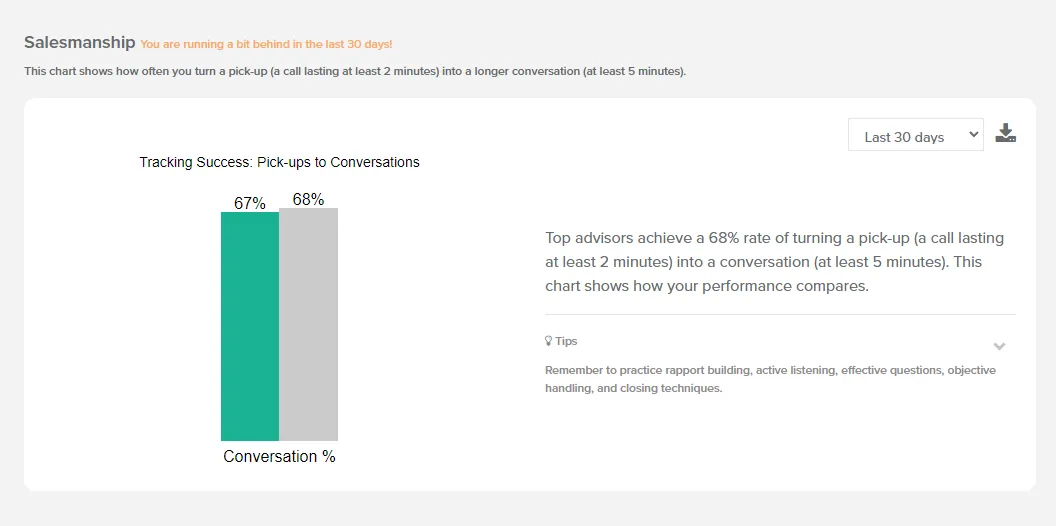
Section titled “Salesmanship”Salesmanship shows how often a pick-up (a call lasting at least 2 minutes) turns into a conversation (a call lasting at least 5 minutes). Top advisors turn 68% of pick-ups into conversations.
If your rate is low, focus on building rapport and identifying the lead’s needs during your calls. Longer conversations increase your chances of success.
Response Times
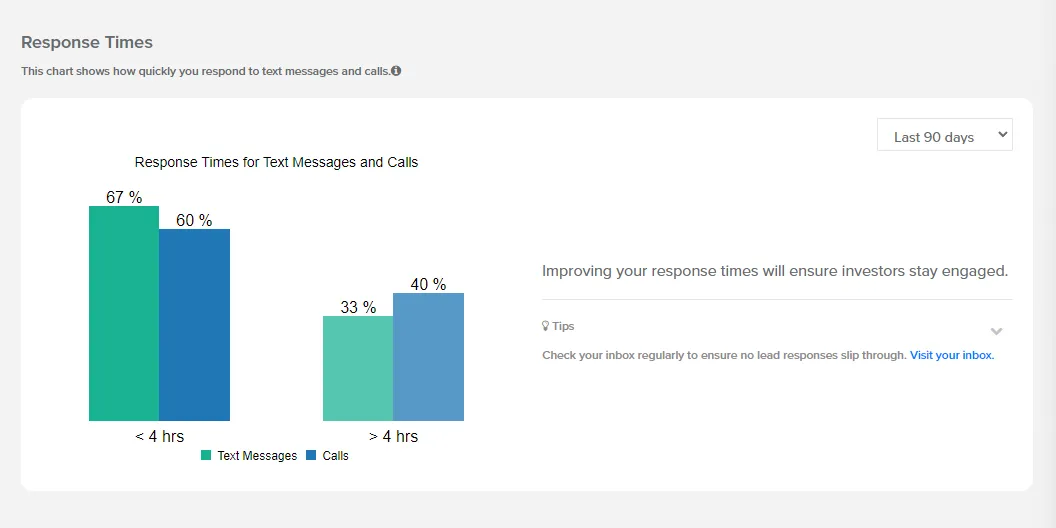
Section titled “Response Times”Response Times shows how quickly you reply to texts and calls from leads. The left bars show replies within 4 hours (< 4 hrs), and the right bars show replies that took longer (> 4 hrs).
- Text Messages are the green bars.
- Calls are the blue bars.
Aim to have most of your replies under < 4 hrs. If many fall under > 4 hrs, check the Inbox page more often. Replying within 4 hours greatly improves your chances of turning prospects into clients.
Idle Leads
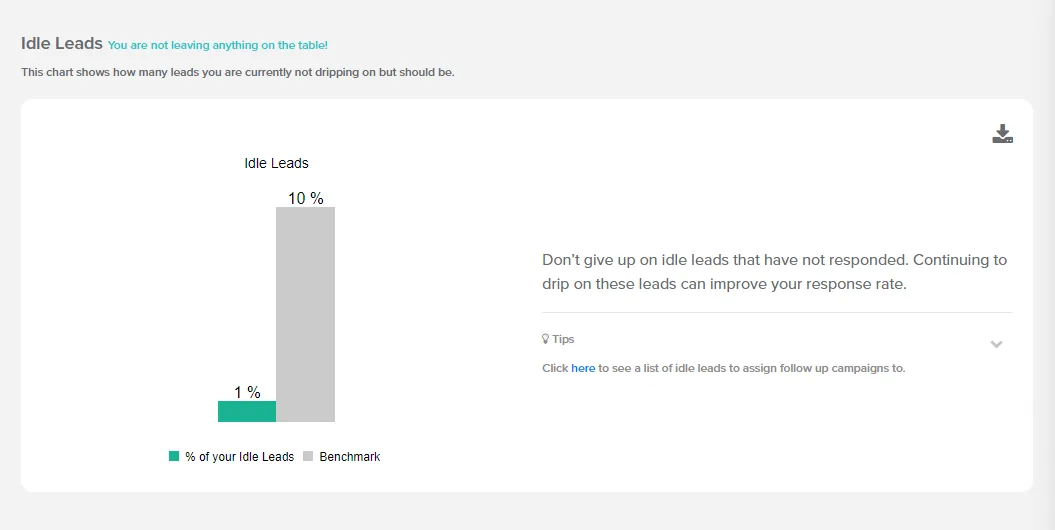
Section titled “Idle Leads”Idle leads are leads you aren’t reaching out to anymore: their campaign is Finished, or they have No Campaign. Top advisors keep idle leads at 10% or less.
To see which leads are idle, open the chart’s Tips and click here. Your Idle filtered lead list opens. Reach out with a personalized message, or select the leads and use Bulk Edit > Assign Campaign to start a follow-up campaign.
Related Guides
Section titled “Related Guides”- Next Tasks: work through your scheduled call tasks (Consistency)
- Inbox: see new texts and calls so you can reply quickly (Response Times)
- Filtering your Leads: open and work saved lists such as Idle
- Pipeline Report: follow your SmartAsset leads from delivery to meetings